d3-timeseries-multi-chart 

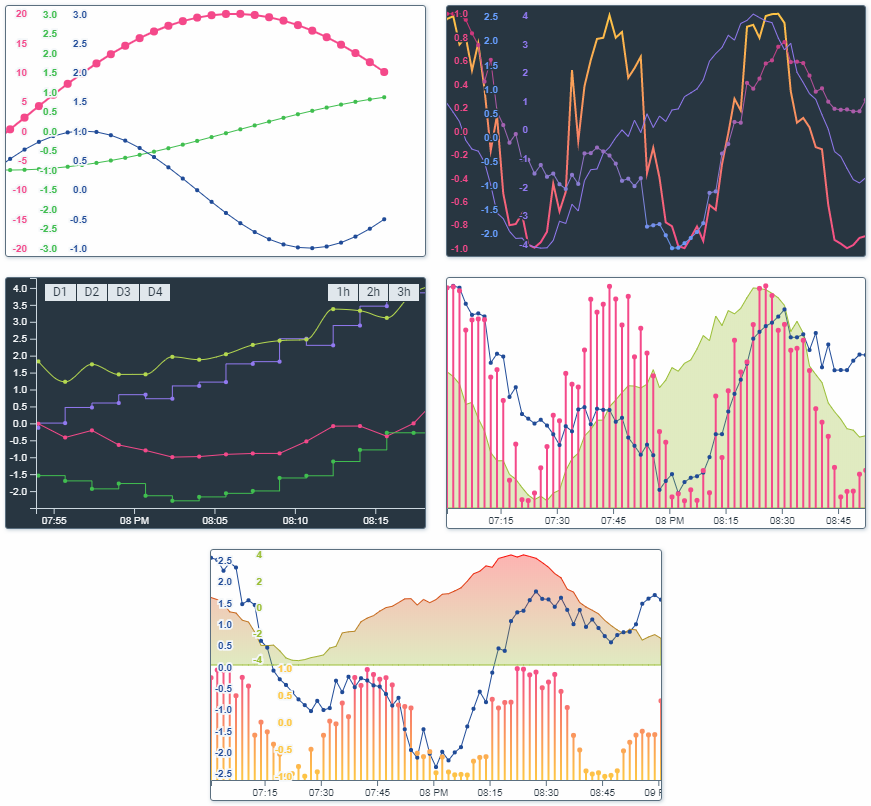
Chart for multi timeseries datastreams.
Features
- Draw some data lines on same chart.
- Draw separate axises or common one for data lines.
- Canvas render mode for data lines to level up performance.
- Zoom and drag time periods.
- Use Line, Area or Bar drawing styles for data lines.
- Some curve types for data lines.
- Preview data values on mouse over.
- Allow to live update chart's data.
Demo
[ >> Online demo << ]
Install
# Yarn
yarn add @avinlab/d3-timeseries-multi-chart

# NPM
npm install --save @avinlab/d3-timeseries-multi-chart
Usage
import TimeseriesMultiChart from '@avinlab/d3-timeseries-multi-chart';

const chart = new TimeseriesMultiChart({
    target: '#chartContainer',
    chartDuration: 3600 * 1000,
    width: 800,
    height: 600,
    showTimeAxis: false,
});
chart.render([
    {
        label: 'Data 1',
        color: '#F5498B',
        data: [
            [new Date('2019-01-05 13:00:00'), 1.5],
            [new Date('2019-01-05 13:01:00'), 1.2],
            [new Date('2019-01-05 13:02:00'), 1.0],
            [new Date('2019-01-05 13:03:00'), 0.5],
        ],
        showAxis: true,
        strokeWidth: 2,
    },
    {
        label: 'Data 2',
        color: '#43BF4D',
        data: [
            [new Date('2019-01-05 13:00:00'), 3.2],
            [new Date('2019-01-05 13:01:00'), 1.2],
            [new Date('2019-01-05 13:02:00'), 5.2],
            [new Date('2019-01-05 13:03:00'), 1.2],
        ],
        showAxis: true,
        showDots: true,
    },
]);
API
Chart options
-
target(String | Element) - target element to mount chart svg (default:#chart). -
renderMode(String) - render mode for dataLines drawing (canvas|svg) (default:canvas). -
width(Number) - width of chart (default:500). -
height(Number) - height of chart (default:300). -
chartDuration(Number) - default chart duration (default:3600000(1hour)). -
showTimeAxis(Boolean) - show time axis (default:true). -
timeAxisHeight(Number) - time axis height (default:20). -
tipTimeWidth(Number) - tip time width (default:125). -
tipTimeFormat(String) - tip time dateTime format string (default:%Y-%m-%d %H:%M:%S). -
commonDataAxis(Boolean) - common axis for data lines (default:false). -
commonDataAxisWidth(Number) - width of common data axis (default:30). -
autoScale(Boolean) - auto scale data points of visible part. -
chartPaddingFactor(Number) - data lines padding factor : 1/N of chart height (less is more) (default:30). -
draggable(Boolean) - allow to drag (default:true). -
zoomable(Boolean) - allow to zoom (default:true). -
showMouseTip(Boolean) - enable on mouseover values display (default: ). -
minZoomTime(Number) - min limit for zooming (-1 is disabled) (default:-1). -
maxZoomTime(Number) - max limit for zooming (-1 is disabled) (default:-1). -
dataAxisTickHeight(Number) - tick of data axis height (default:20).
Chart methods
-
render- render data on chart. Params: (DataStreamsArray- required first time) -
update-rendermethod alias. -
setChartDuration- update chart duration (change time zoom level). Params: (newChartDuration) -
setLastChartTime- update last chart time (change chart position). Params: (newLastChartTime) -
on- add event handler. -
off- remove event handler.
Chart DataStreamsArray item options
-
data(Array) Required - array of data values. Array item structure: [date: DateTime, value: Number]. -
color(String) - color string for data line. -
colorGradient(Array) - colors for data line gradient fill. -
label(String) - dataStream human name. -
showAxis(Boolean) - show Y axis for current dataStream (default:true). -
strokeWidth(Number) - stroke width of data line (default:1). -
showDots(Boolean) - show data points on data line (default:false). -
dotsRadius(Number) - data points radius (default: x2 of strokeWidth). -
type(String) - type of data line (line|area|bar) (default:line). -
areaFillOpacity(Number) - opacity factor for color filling of area data line type. -
curve(String) - data line curve type (linear|stepAfter|stepBefore|monotoneX) (default:linear). -
scaleRange(array) - Scale result range in percents of chart height[min, max]. For Example[0, 50]- draw data line in bottom part of chart and [50, 100] in top one. -
scaleDomain(Array) - Custom scale domain[min, max]. -
scaleVisible(Boolean) - Auto scale data line in visible time period.
Event handlers params
zoom
-
beforeChartDuration- chart duration before zoom -
afterChartDuration- chart duration after zoom -
scaleFactor- zoom scale factor
dragStart
-
startX- mousexvalue on start dragging
dragEnd
-
endX- mouseyvalue on finish dragging
drag
-
beforeLastChartTime- last chart time before drag -
afterLastChartTime- last chart time after drag -
diff- dragging diff in pixels
License
MIT © avin