heatmap
Usage
drawHeatmap({points, width, height, [...args]}) ⇒ Buffer
Returns the Buffer of a png image of the heatmap. The points argument must be an Array containing the following properties: The center of the point px, py, the intensity of the point value. The range of values that makes the gradient are from 0 to 1, but it's possible to give values outside this range. Also, additional arguments can be given to overwrite the defaults for the kernel configuration.
Example
const fs = require("fs");
const heatmap = require("@luxedo/heatmap");

const points = [
  {
    px: 10,
    py: 10,
    value: 1,
    5igma: 30,
  },
  {
    px: 120,
    py: 30,
    value: 0.6,
    sigma: 50,
  },
  {
    px: 70,
    py: 130,
    value: 0.2,
    sigma: 70,
  },
];
const width = 150;
const height = 150;
const buf = heatmap.drawHeatmap(points, width, height);
fs.writeFileSync("example1.png", buf);
example1.png
drawGeoHeatmap({geoCoords, geoPoints, (pxPerDeg || (width | height)), [...args]}) ⇒ {buf (Buffer), origin (Object), end (Object)}
Returns an object with the Buffer (buf) of a png image of the heatmap, the northwestmost and southeastmost (origin, end) coordinates {lat, lng}. Inputs are geoCoords, the boundaries of the image, an Array of coordinates {lat, lng}; and geoPoints, an Array of {lat, lng, value}, configuration is similar to deawHeatmap. One of: pxPerDeg, width, height must be provided.
const geoCoords = [
  {
    lat: 0.0,
    lng: 0.0,
  },
  {
    lat: 0.3,
    lng: 0.3,
  },
];
const geoPoints = [
  {
    lat: 0.1,
    lng: 0.1,
    value: 1,
    sigma: 40,
  },
  {
    lat: 0.1,
    lng: 0.2,
    value: 0.6,
    sigma: 40,
  },
  {
    lat: 0.15,
    lng: 0.2,
    value: 0.2,
    sigma: 100,
  },
];
const pxPerDeg = 500;
const method = "max";
const buf = heatmap.drawGeoHeatmap({ geoCoords, geoPoints, pxPerDeg, method });
fs.writeFileSync("example2.png", buf);
example2.png
Arguments
drawHeatmap:
-
points:Arrayof points to draw[{px, py, value}]. -
width: width of the image. -
height: height of the image. -
colors: Either anObjectfor colormap configuration, or aStringof a default colormap. Options:teelights,jet,parula,gray,magma,plasma,inferno,viridis. -
cropPolygon:Arrayof points[{px, py}]forming a polygon to crop the output image -
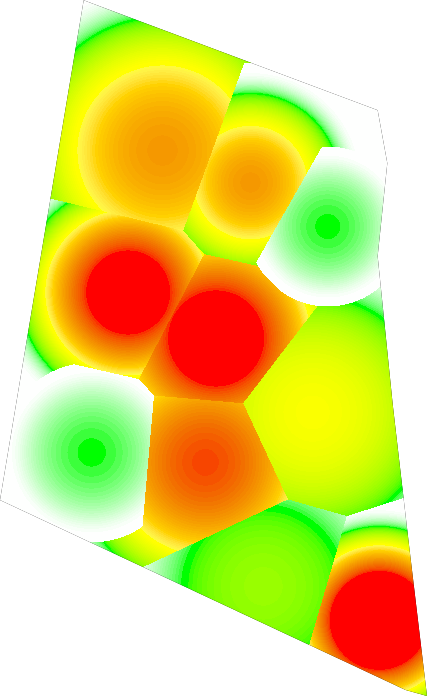
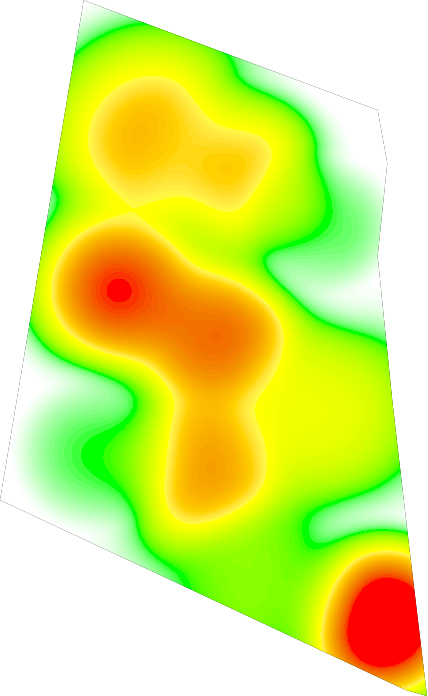
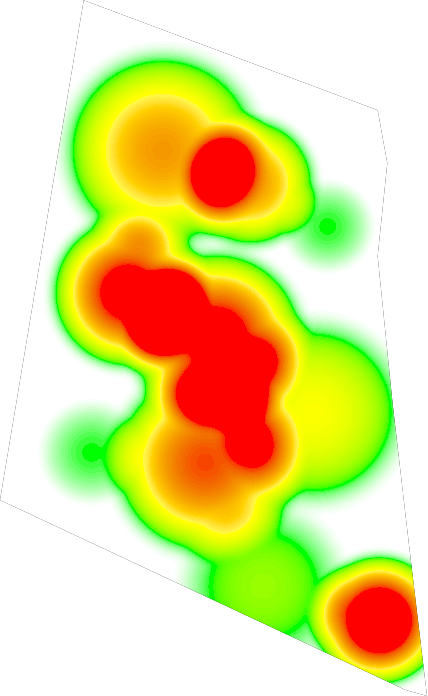
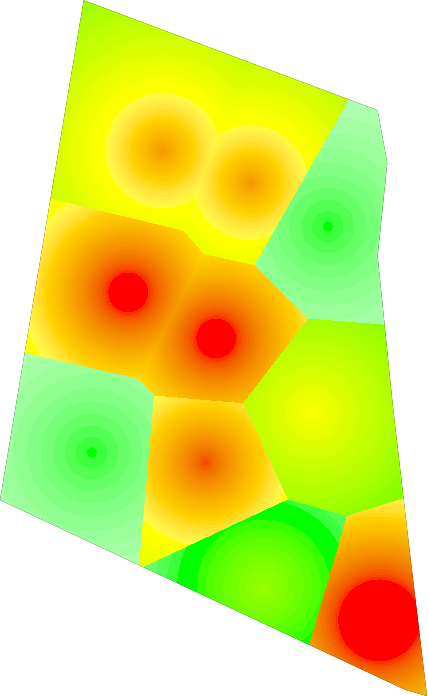
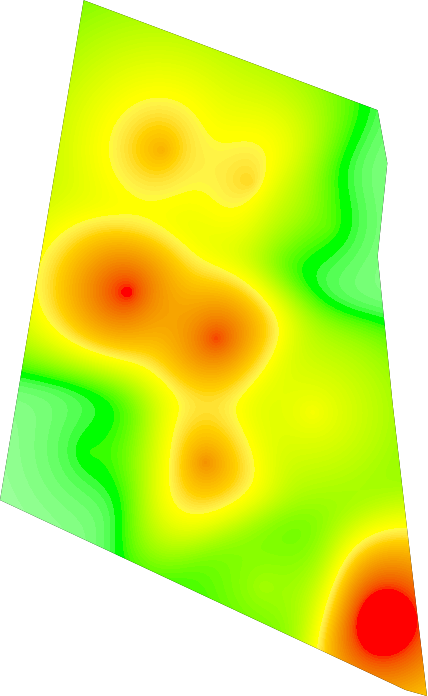
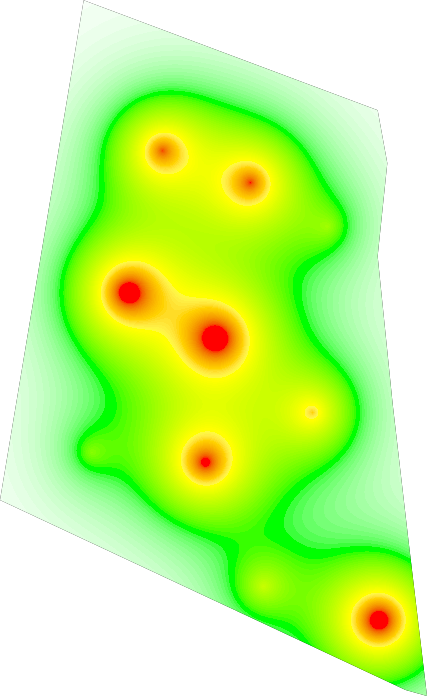
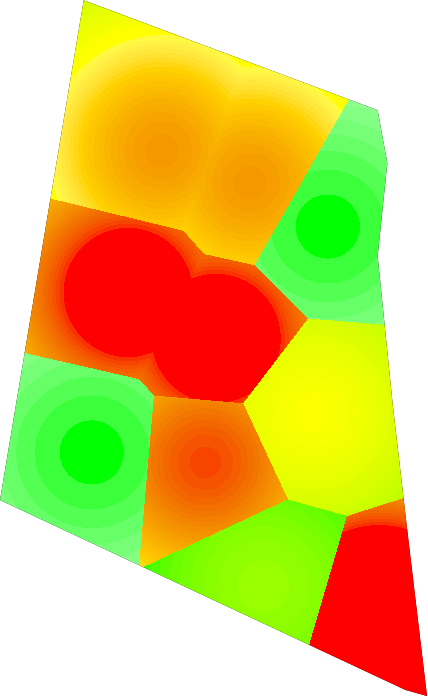
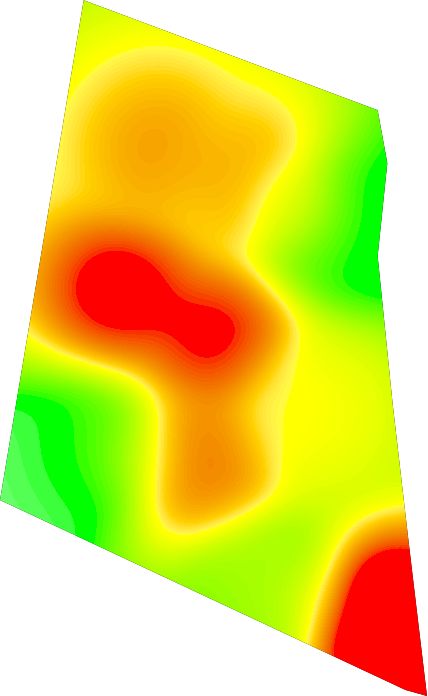
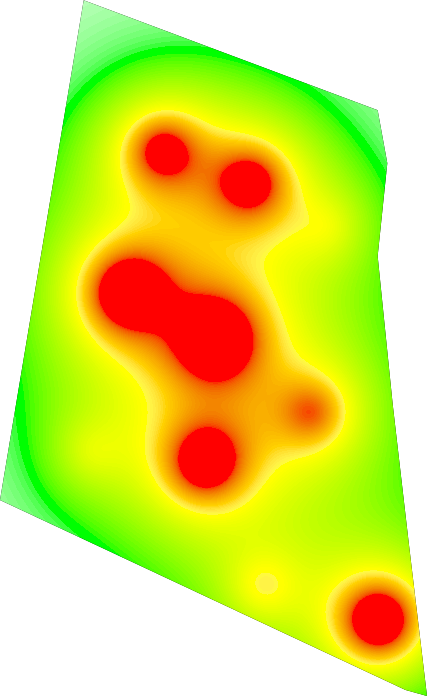
kernel: The RBF kernel for computing the intensity of the heatmap. Options:bump,cosine,dampedCosine,exponential,gaussian.linear,polynomial,step. -
method: The method for accumulating the intensities. Options:max,nearest,shepards,sum. -
methodArgs: Additional arguments for themethod.
drawGeoHeatmap:
-
geoCoords:Arrayof coordinates[{lat, lng}]of the boundaries of the heatmap. May also be used withcropwhen passing more than three coordinates to select the polygon inside the coordinates. -
geoPoints:Arrayof points to draw[{lat, lng, value}]. -
pxPerDeg: Number of pixels per degree of latitude/longitude. To use this scaling mode neitherwidthandheightcan be provided. -
width: Forces the image to have a certain width. Can be used alongside withheight. -
height: Forces the image to have a certain height. Can be used alongside withwidth. -
colors: Either anObjectfor colormap configuration, or aStringof a default colormap. Options:teelights,jet,parula,gray,magma,plasma,inferno,viridis. -
crop: Crops the polygon of the boundaries gven ingeoCoordsiftrue. -
kernel: The RBF kernel for computing the intensity of the heatmap . Options:bump,cosine,dampedCosine,exponential,gaussian.linear,polynomial,step. -
method: The method for accumulating the intensities. Options:max,nearest,shepards,sum. -
methodArgs: Additional arguments for themethod.
Command line
$ heatmap --help
Usage: heatmap [-g] -i input_file -o output_file       heatmap [-g] [--] file

Options:
  --help        Show help                                              [boolean]
  --version     Show version number                                    [boolean]
  --geo, -g     Receives input as geographic data                      [boolean]
  --input, -i   Input json file with the configurations                 [string]
  --output, -o  Output png file                                         [string]
  --            Receives input from stdin and outputs to stdout

Example:
echo '{"points": [{"px": 10, "py": 10, "value": 1, "sigma": 30},
  {"px": 120, "py": 30, "value": 0.6, "sigma": 50},
  {"px": 70, "py": 130, "value": 0.2, "sigma": 70}],
  "width": 150,
  "height": 150,
  "method": "nearest"}' | bin/heatmap -- > example3.png

   See https://github.com/luxedo/heatmap for configuration details.
example3.png
Installation
Install via npm:
$ npm install @luxedo/heatmapYou need to have Cairo installed.
Kernels
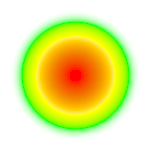
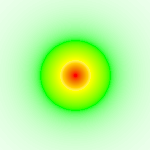
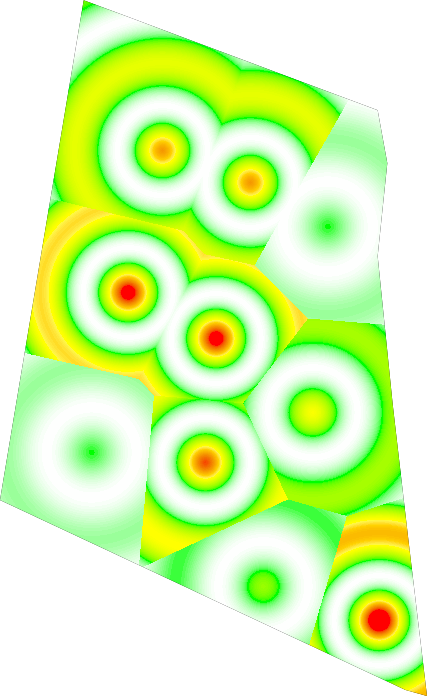
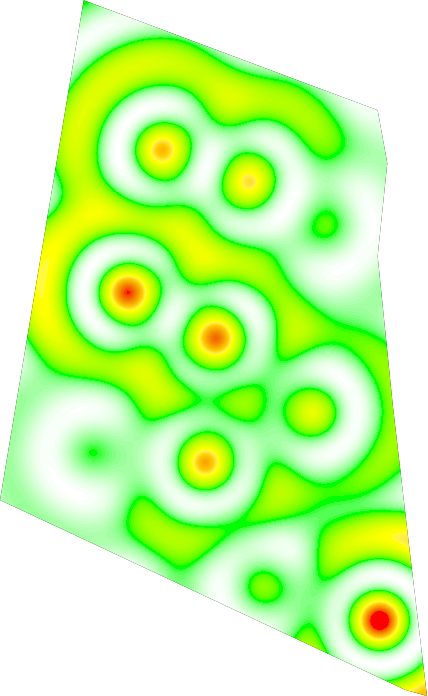
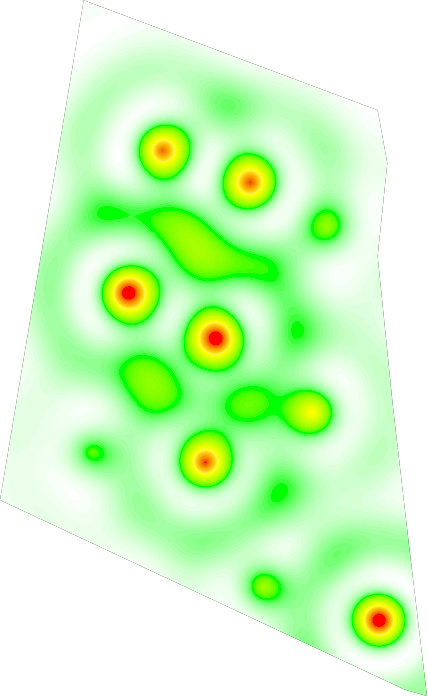
There are 8 kernels used as Radial Basis Functions for determining the intensity of each pixel in the heatmap:
| bump | cosine | dampedCosine | exponential |
 |
 |
 |
 |
| gaussian | linear | polynomial degree 2 | step |
 |
 |
 |
 |
bump
arguments:
-
radius: Radius of the bump
cosine
arguments:
-
omega: Angular frequency -
phi: Phase
dampedCosine
arguments:
-
omega: Angular frequency -
phi: Phase -
epsilon: Decay
exponential
arguments:
-
epsilon: Decay
gaussian
arguments:
-
sigma: Standard deviation
linear
arguments:
-
epsilon: Decay
polynomial
arguments:
-
epsilon: Decay -
degree: Degree of the polynomial
step
arguments:
-
radius: Radius of the step
sigmoidBorder
arguments:
-
radius: Radius in pixels -
epsilon: Softness of the border -
sigma: Scaling factor
Geo Kernels
Geo Kernels are meant to add consistency for geographical data heatmaps
by using more intuitive arguments and scaling the kernels correctly.
These kernels are avaliable only for drawGeoHeatMap:
geoGaussian
arguments:
-
radius: Radius of the gaussian in meters
geoSigmoidBorder
arguments:
-
radius: Radius in meters -
epsilon: Softness of the border -
sigma: Scaling factor
Methods
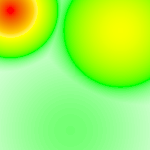
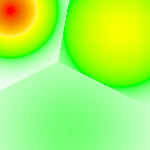
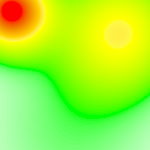
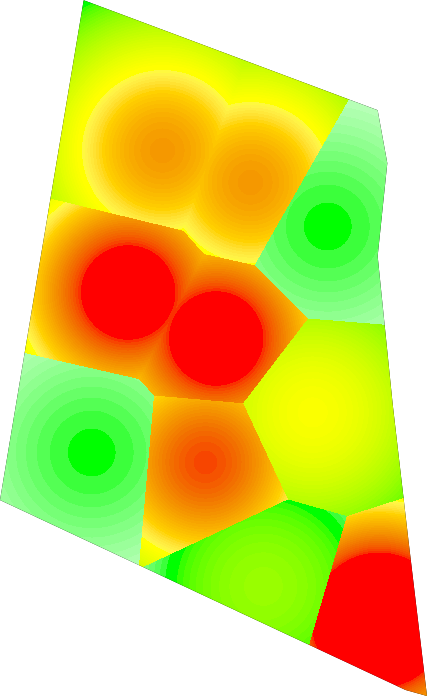
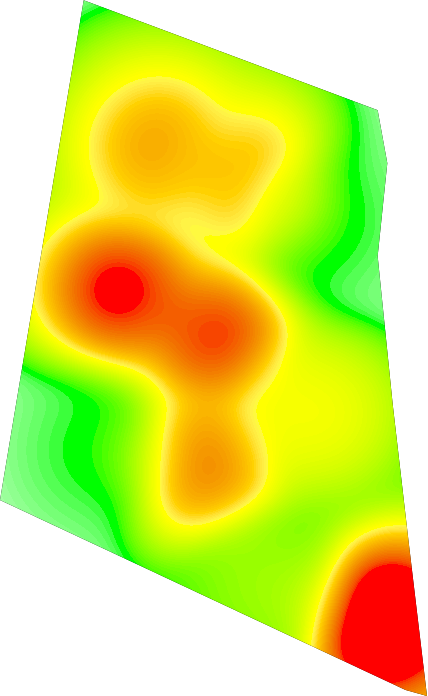
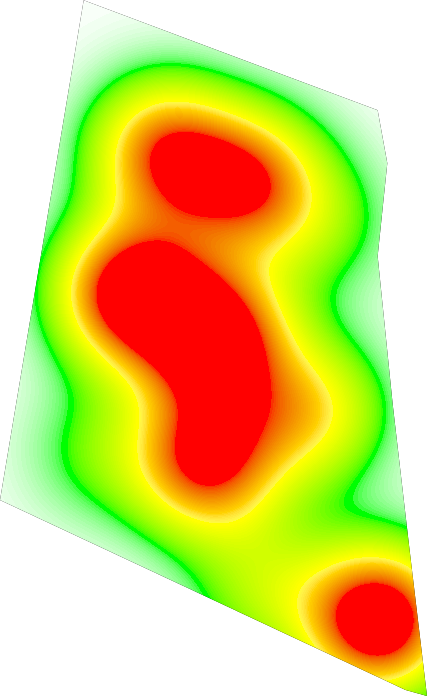
There are 5 methods for accumulating the values of the points:
| max | nearest | shepards | sum | alphaShepards |
 |
 |
 |
 |
 |
max
Gets the maximum value of any point
nearest
Gets the value for the nearest point
shepards
Computes a weighted sum of the points using a kernel. The default value is polynomial degree 5.
alphaShepards
Applies the shepards algoritm and also interpolates in the alpha channel
arguments:
-
kernel: Name of the kernel (optional) -
kernelArgs: Extra arguments for the kernel (optional)
sum
Sums the values of all points.
Colors
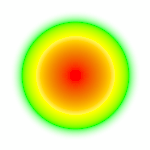
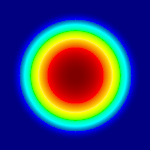
The first option for configuring the colormap is by chosing one of the default colors:
| teelights default | jet | parula | gray |
 |
 |
 |
 |
| magma | plasma | inferno | viridis |
 |
 |
 |
 |
The second option is an Object containing the following properties:
-
steps: Number of colors for interpolation. -
colors: AnArrayof the colors in the colormap in hex. -
weights: AnArrayof weights for each color (optional).
Example
const fs = require("fs");
const heatmap = require("@luxedo/heatmap");

const points = [
  {
    px: 10,
    py: 10,
    value: 1,
    sigma: 30,
  },
  {
    px: 120,
    py: 30,
    value: 0.6,
    sigma: 50,
  },
  {
    px: 70,
    py: 130,
    value: 0.2,
    sigma: 70,
  },
];
const width = 150;
const height = 150;

let colors = {
  steps: 30,
  values: ["#111122", "#44AA11", "#DDDDFF"],
  weights: [1, 2, 3],
};
buf = heatmap.drawHeatmap({ points, width, height, colors });
fs.writeFileSync("example4.png", buf);
example4.png
More Examples
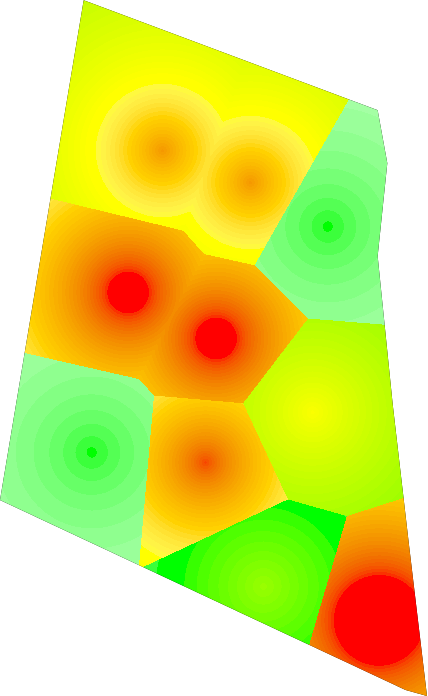
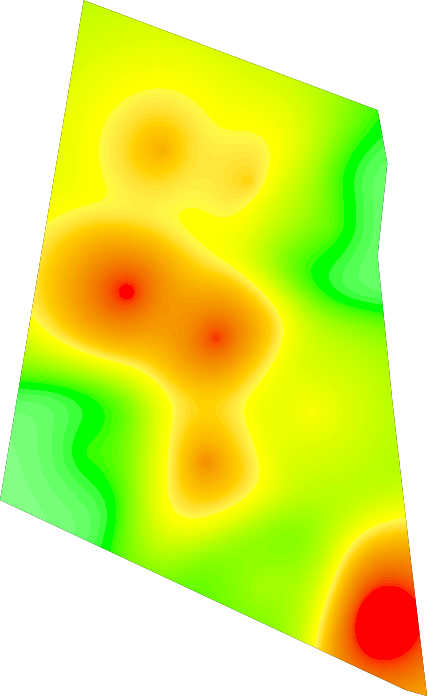
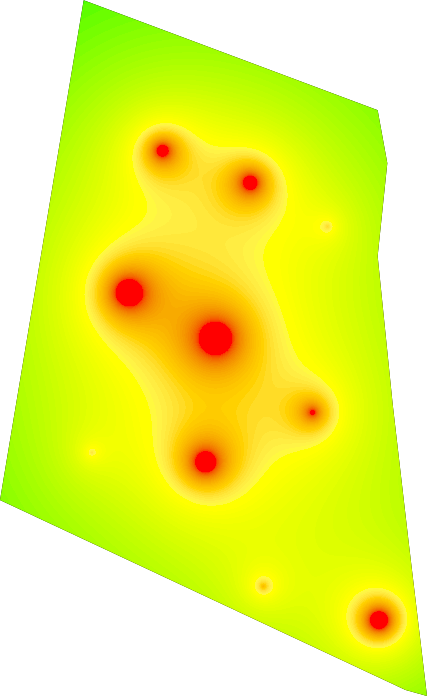
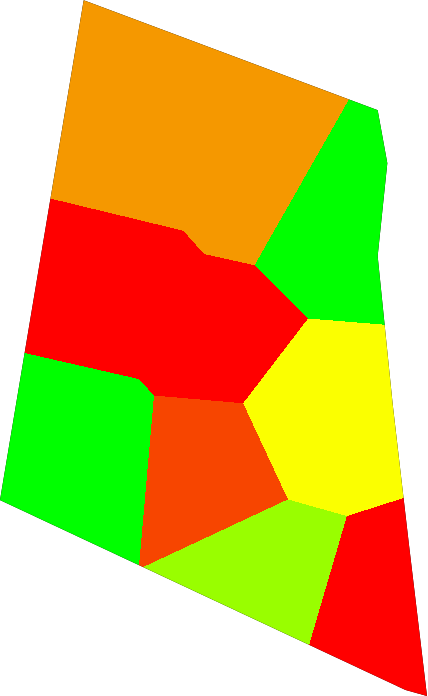
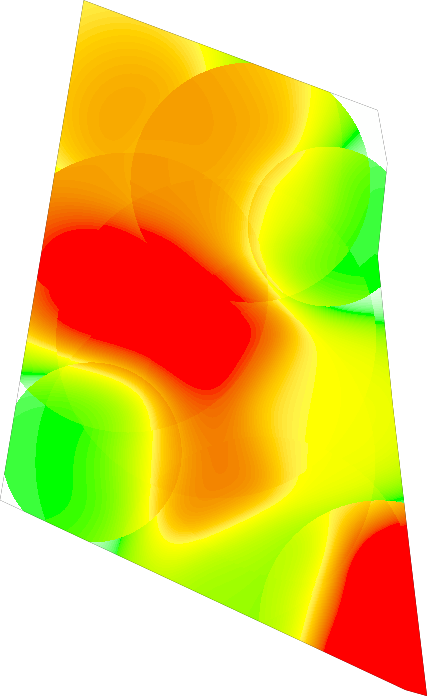
| kernel/method | max | nearest | shepards | sum |
|---|---|---|---|---|
| bump |  |
 |
 |
 |
| cosine | 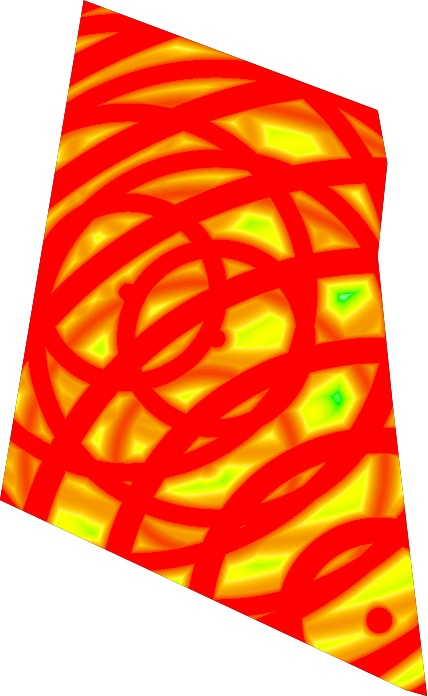 |
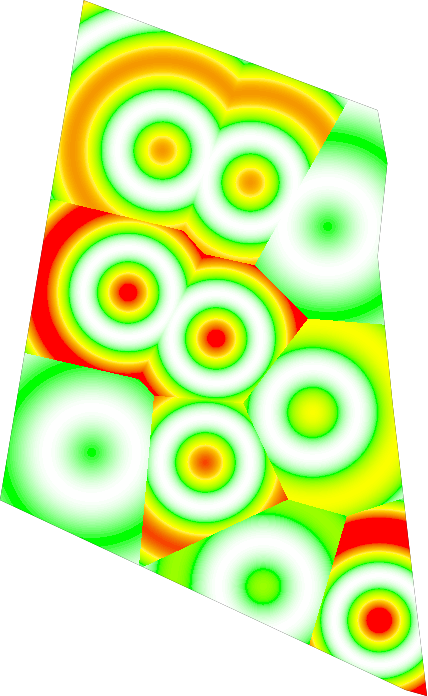 |
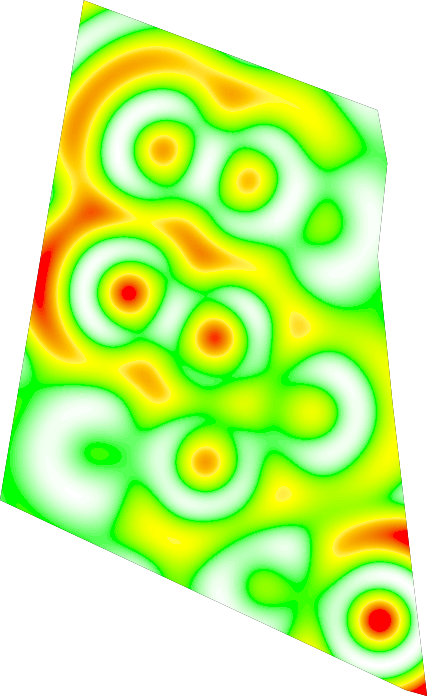 |
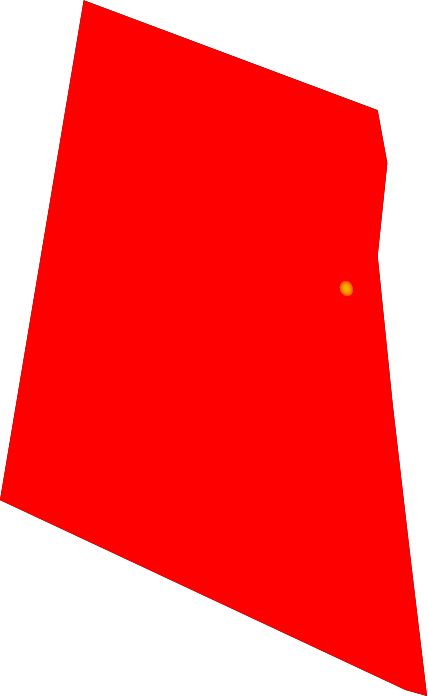 |
| dampedCosine | 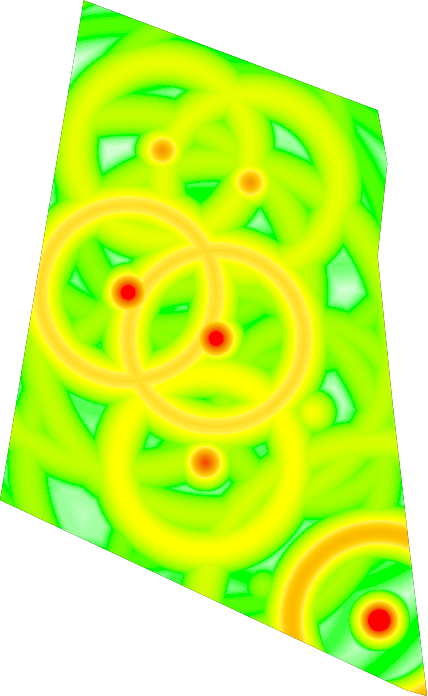 |
 |
 |
 |
| exponential | 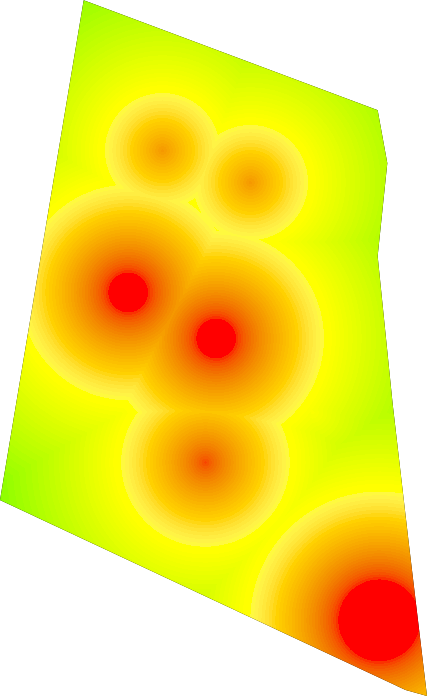 |
 |
 |
 |
| gaussian | 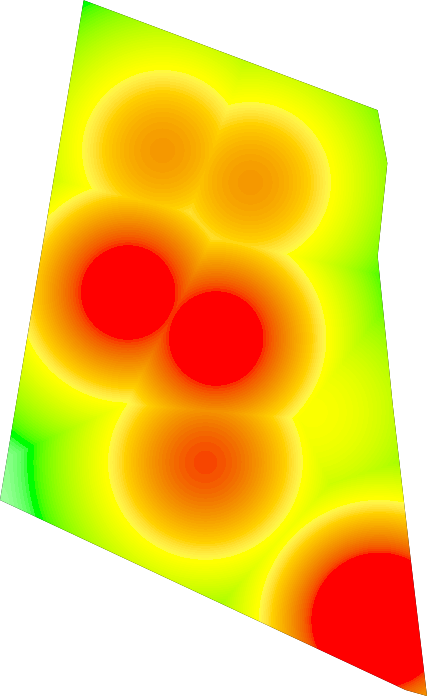 |
 |
 |
 |
| linear | 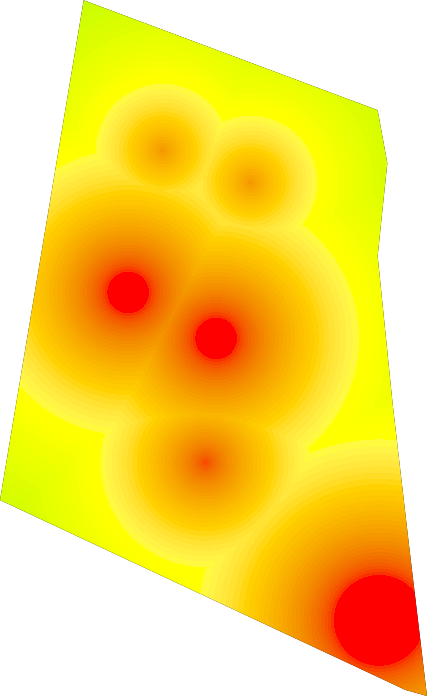 |
 |
 |
 |
| polynomial | 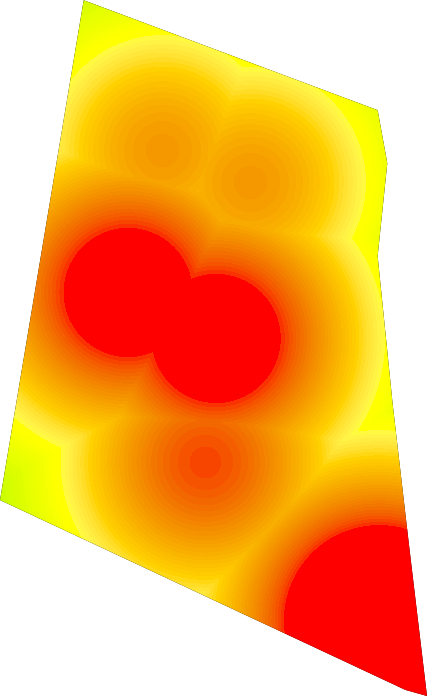 |
 |
 |
 |
| step | 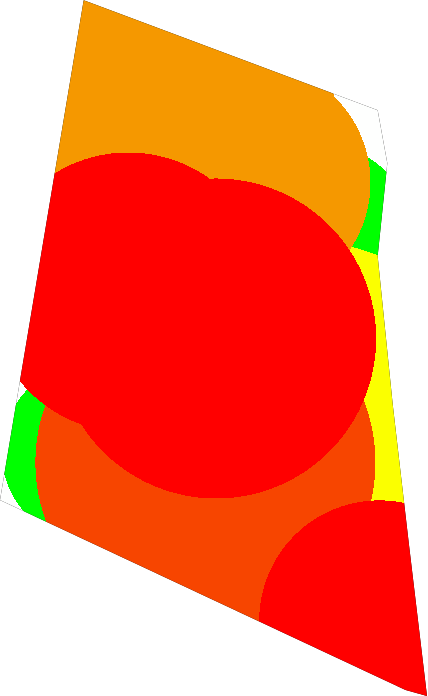 |
 |
 |
 |
License
@luxedo/heatmap - Creates heatmaps from latitude and longitude data MIT License
Copyright (c) 2020 Luiz Eduardo Amaral
Permission is hereby granted, free of charge, to any person obtaining a copy of this software and associated documentation files (the "Software"), to deal in the Software without restriction, including without limitation the rights to use, copy, modify, merge, publish, distribute, sublicense, and/or sell copies of the Software, and to permit persons to whom the Software is furnished to do so, subject to the following conditions:
The above copyright notice and this permission notice shall be included in all copies or substantial portions of the Software.
THE SOFTWARE IS PROVIDED "AS IS", WITHOUT WARRANTY OF ANY KIND, EXPRESS OR IMPLIED, INCLUDING BUT NOT LIMITED TO THE WARRANTIES OF MERCHANTABILITY, FITNESS FOR A PARTICULAR PURPOSE AND NONINFRINGEMENT. IN NO EVENT SHALL THE AUTHORS OR COPYRIGHT HOLDERS BE LIABLE FOR ANY CLAIM, DAMAGES OR OTHER LIABILITY, WHETHER IN AN ACTION OF CONTRACT, TORT OR OTHERWISE, ARISING FROM, OUT OF OR IN CONNECTION WITH THE SOFTWARE OR THE USE OR OTHER DEALINGS IN THE SOFTWARE.


