SYNOPSIS
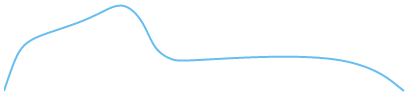
Ultra simple streaming line graph
DESCRIPTION
Create a basis interpolated bezier path based on the data from a continious stream
USAGE
Create a writable stream, pass in some options and then write to the stream. Writes
should be arrays of x and y coordinates ([x,y]) or arrays of arrays of coordinates (batches).
EXAMPLE
Input
var createBezierStream = var opts = domainWidth: 50 domainHeight: 1 domainWidthStart: 0 //optional, default: 0 domainHeightStart: 0 //optional, default: 0 clientWidth: 500 clientHeight: 100 var s = // do some random writes both in batch and one-off//ssssss sOutput
Below is the actual data read from the stream's last data event. You could read this and update the d attribute of the path element inside an svg fragment on the client.
M0,90L1.6666666666666665,85C3.333333333333333,80,6.666666666666666,70,10,61.666666666666664C13.333333333333332,53.33333333333333,16.666666666666664,46.666666666666664,23.33333333333333,41.666666666666664C29.999999999999996,36.666666666666664,39.99999999999999,33.33333333333333,50,29.999999999999996C59.99999999999999,26.666666666666664,70,23.333333333333332,78.33333333333331,20C86.66666666666666,16.666666666666664,93.33333333333331,13.333333333333332,99.99999999999999,10C106.66666666666666,6.666666666666666,113.33333333333333,3.333333333333333,119.99999999999999,5C126.66666666666666,6.666666666666666,133.33333333333331,13.333333333333332,138.33333333333331,21.666666666666664C143.33333333333331,29.999999999999996,146.66666666666666,39.99999999999999,151.66666666666666,46.666666666666664C156.66666666666666,53.33333333333333,163.33333333333331,56.666666666666664,168.33333333333331,58.33333333333333C173.33333333333331,60,176.66666666666666,60,206.66666666666669,58.33333333333333C236.66666666666669,56.666666666666664,293.33333333333337,53.33333333333333,330,58.33333333333333C366.6666666666667,63.33333333333333,383.3333333333333,76.66666666666666,391.66666666666663,83.33333333333333L400,90