d3.chart.bubble-matrix
A bubble-matrix chart, working on any kind of bidimensional data.

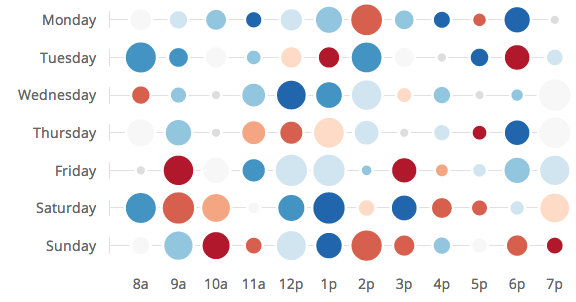
- useful to represent data on two dimensions, each datum being able to have two specific traits represented by size and color;
- based on the powerful Data-Driven Documents library;
- based on the d3.chart abstraction, making the chart fairly flexible;
- can dynamically change data, keeping track or removed/added rows and columns and animating headers & bubbles.
Install
With [npm]:
npm install d3.chart.bubble-matrix
You can then use browserify to use the library in your client-side javascript (recommended).
If you want to use the library with any other module system, you can generate a standalone package with browserify. In the project directory:
browserify src/chart.js --standalone
Additionally you should include the styles provided at the npm package root:
style.css— mandatory CSS;theme.css— theme CSS, can be replaced by a custom one.
Sample Use
browserify example.js > example.bundle.js
<!-- index.html --> /*! example.js */var d3 = ;var chart = ; var chart = d3 width400height200; chart;/*! data.js */moduleexports = columns: 'the' 'cake' 'is' 'a' 'lie' rows: name: 'foo' values: 013 069 084 049 031 097 075 029 064 09 name: 'bar' values: 098 096 013 07 027 064 017 024 094 03 name: 'baz' values: 094 01 039 063 007 027 098 002 025 094 name: 'glo' values: 03 014 039 04 054 023 035 047 071 071 ;This will draw a simple bubble matrix, with the default color palette. You can find this example in the example/minimal folder.
When nothing is configured except width and height, the library makes a lot
of assumptions about how is organized your data. However, you can customize a
lot data organization with the provided interface.
To play with the example in live, clone the repo, grab the packages npm install, run npm run example and go to
localhost:3000. See also
CONTRIBUTING.
API
Methods
chart.draw(data)
dataObject Data to represent.
Draw the chart.
Properties
Each configuration function returns the current value of the property when called with no argument, and sets the value otherwise.
chart.rows([fn])
fn(data)Function Called with the data, must return an Array of rows.
Required. Default: function(d) { return d.rows; }.
chart.rowHeader([fn])
fm(datum)Function Called for each row, must return a String to be displayed as the row header.
Required. Default: function(d) { return d.name; }.
chart.rowKey([fn])
fn(datum)Function Called for each row, must return a String that identifies uniquely the row.
When rows are updated by subsequent calls to draw, rows will be removed,
added; or updated/moved when a key match an existing row. Optional.
chart.rowData([fn])
fn(datum)Function Called for each row, must return anObjectcontaining bubble data for this row.
Required.
chart.columns([fn])
fn(data)Function Called with the data, must return anArraycontaining each column datum.
Note you don't specifically have to store the column array into the data
provided to draw. You can build on-the-fly the column data in this function
if you wish. For instance, in example/example.js, we build column information
from a range stored in the data:
chart Required. Default: function(d) { return d.columns;}.
chart.colHeader([fn])
fn(datum)Function Called for each column, must return a String to be displayed as the column header.
Required. Default: function(d) { return d; }.
chart.colKey([fn])
fn(datum)Function Called for each column, must return a String that identifies uniquely the column.
When columns and bubbles are updated by subsequent calls to draw, columns
will be removed, added; or updated/moved when a key match an existing column.
Optional.
chart.size([fn])
fn(datum)Function Called for each bubble, must return a Number driving the bubble sizes.
Required. Default: function(d) { return d[0]; }.
chart.color([fn])
fn(datum)Function Called for each bubble, must return a Number driving the bubble color.
Note, if you want, you can return a fixed value and only use the size feature of the bubbles; or, you can return a value correlated with the size.
Required. Default: function(d) { return d[1]; }.
chart.sizeDomain([value])
valueArray Domain of the values returned bysize. Must contain the min and max of acceptable values.
The actual radius of the bubbles is the square root of the size obtained after normalization. This ensures that bubble areas represent accurately the size (and not the radius/width).
Required. Default: [0, 1].
chart.colorScale([fn])
fn(value)Function Color scale used to translate color values to actual colors. Must return a color.
You may want to create the scale with d3.js, eg.
var palette = '#ff0000' '#00ff00' '#0000ff'; chart;Required. A default color scale from red to blue is provided.
Events
Listen to events with the method on of d3.chart.
margin(value)
valueNumber the margin width.thisthe chart itself.
Sent when the left margin width changes. It is useful to align the SVG element on your paragraphs. Example:
var chart = d3 ; chart;The value base in the chart is the root d3 selection, generally the SVG.
Compatibility and Limitations
- Tested on Chrome 30, Firefox 22 and IE10;
- does not resize the headers font, if the chart is dynamically resized to be tiny, it may not be very good-looking (but you can change the font with CSS or via d3.chart layer events);
- does not support — yet — slanted headers to accomodate long texts;
- animations might become slow if you have a lot of bubbles displayed.
Please feel free to open pull requests to make any change. See CONTRIBUTING.