react-sigma-graph
A react component that allows simple integration of sigma.js visualizations. You provide your data defined as an array of nodes and edges, and that's it. This library automatically uses d3 to compute the layout the of the graph. It also integrates several sigma.js plugins, such as animate, edge labels, and snapshot to allow downloading images of the graph.
Example Usage
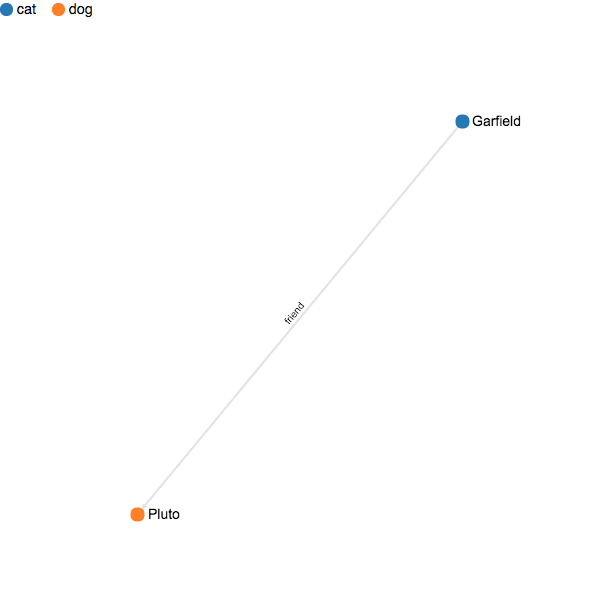
; ; { var _data = nodes: id: 'a' category: 'cat' name: 'Garfield' id: 'b' category: 'dog' name: 'Pluto' // edge labels and types are optional edges: source: 'a' target: 'b' label: 'friend' type: 'arrow' ; // optional color definition, defaults to d3 category10 based on domain of categories in data var _categoryColors = 'cat': '#1f77b4' 'dog': '#ff7f0e' ; return <Graph data=_data categoryColors=_categoryColors /> ; } ;