Trazar
Introduction
Trazar is a utility that converts test output to charts. Some CI servers (like Buildbot) don't show test reports w/o customization. If you're using a lightweight CI server, trazar can be used to generate test graphs for your projects.
Currently supported formats:
- xunit
- json (from mocha reporter)
Installation
Prerequisites
Install node-canvas dependencies (cairo, pixman, pkg-config, freetype, libpng). There is an install script that ships w/ node-canvas if you don't want to follow one of the system-specific guides. I have not used this script, but it may work for you.
NOTE: Follow the advice in the installation guide(s) and be sure you have all the relevant pkg-config files in your PKG_CONFIG_PATH environment variable.
NOTE: Some linux distributions (like CentOS) may ship with incredibly old versions of cairo, and other libraries. If this is the case, you'll need to install newer versions for node-canvas to work.
Install globally for command line usage:
$ npm install -g trazar
To use as library, install as NPM dependency
$ npm install --save trazar
Examples
Please see the API markdown for options and more detailed information.*
Command Line Usage
$ trazar --help
$ trazar <path/to/dir/with/xunit/files> chart.png
Library Usage
var trazar = require('trazar');
var source = "path/to/some/dir;

var options = {
    successStrokeColor : "#000000"
};

var outFile = __dirname + '/bar.png';
var promise = trazar.from('xunit', source, options).chart('bar', outFile);

promise
    .then(function(result) {
        console.log("Chart generated!");
    })
    .catch(function(err) {
        console.error(err);
    });
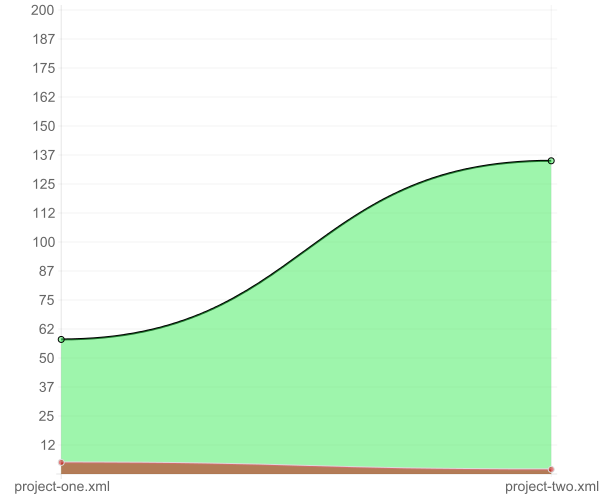
This will generate something like this: